Application Insight Introduction
This blog introduces what Application Insight can do.
Application Insight Basics
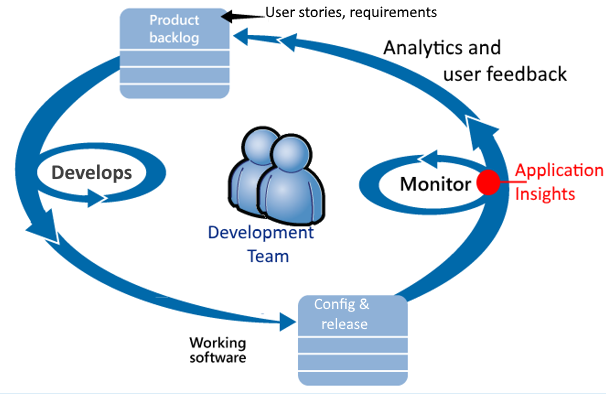
Application Insights is aimed at the development team, to help you understand how your app is performing and how it’s being used.
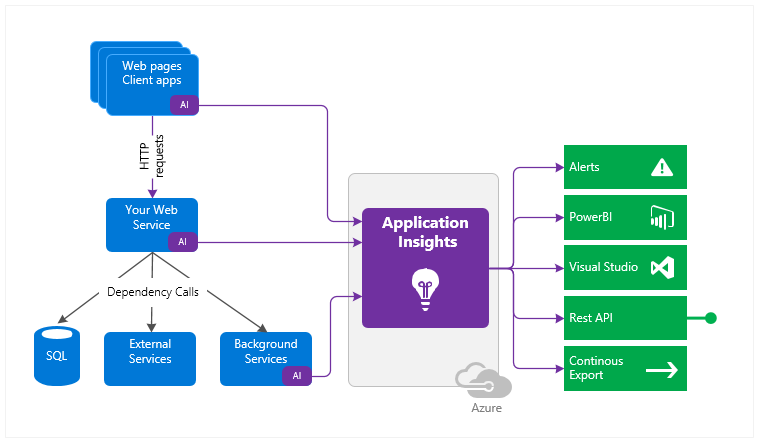
It includes functions:
Detect, triage, and diagnose issues in web apps and services (Detect: Know about any issues before your users, Triage: how many users are affected? How often does this happen? Diagnose: Where is the problem? When does it happen?)
Detect issues through email and webhook alerts
Diagnose exceptions and web app performance issues
Perform root cause analysis with ad-hoc queries and full-text search
Live application monitoring
HTTP request rates, response times, success rates.
Dependency (HTTP & SQL) call rates, response times, success rates.
Exception traces from both server and client.
Page view counts, user and session counts, browser load times, exceptions.
AJAX call rates, response times and success rates.
Server performance counters. (your Windows or Linux server machines, such as CPU, memory, and network usage)
Segmentation by client location, browser version, OS version, server instance, custom dimensions, and more.
Availability tests.
Host diagnostics from Docker or Azure.
Diagnostic trace logs from your app - so that you can correlate trace events with requests.
Custom events and metrics that you write yourself in the client or server code, to track business events such as items sold or games won.
Integrate with DevOps processes using Visual Studio Team Services
Monitor web apps hosted on Azure, other cloud services, or on-premises servers
Get started with Visual Studio or monitor existing apps without re-deploying
Diagnostic and analytic tools:
Smart and manual alerts on failure rates and other metrics, and on availability.
Charts over time of aggregated metrics.
Diagnostic search on instances of requests, exceptions, custom events, log traces, page views, dependency and AJAX calls.
Analytics - a powerful query language over your telemetry
Dashboards - compose the charts you need to monitor all your app components.
The Dependency Duration chart shows the time taken by calls from your app to external components such as databases, REST APIs, or Azure blob storage.
Application map
Profiler
Live Metrics Stream
Visual Studio
Snapshot debugger
Power BI
REST API
Continuous Export
Other Good Articles
Azure cloud service support: https://docs.microsoft.com/en-us/azure/azure-monitor/app/cloudservices
Feed PowerBI with application insight: https://docs.microsoft.com/en-us/azure/azure-monitor/app/export-power-bi
Billing service https://github.com/Microsoft/peek
Platform support: https://docs.microsoft.com/en-us/azure/azure-monitor/app/platforms
Work item for app insight: https://azure.microsoft.com/en-us/blog/application-insights-work-item-integration-with-visual-studio-team-services/
Application insight can also support Application Performance Management (APM) and AB testing.
Written by Binwei@Singapore