Telemetry: Overview
Telemetry technology plays more and more important role in the ‘cloud era’. This blog will explain what is telemetry technology, how we can benefit from telemetry technology, and briefly discuss some technical choices.
What is Telemetry
According to Wikipedia: Telemetry is an automated communications process by which measurements and other data are collected at remote or inaccessible points and transmitted to receiving equipment for monitoring.
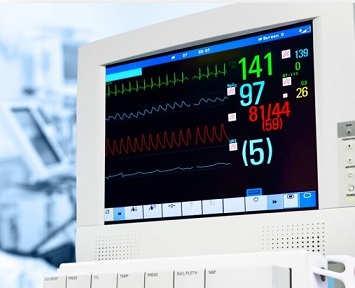
Telemetry technology is heavily used in our life, e.g. monitoring in hospital.
In software world, Telemetry plays similar role.
Imaging 20 years ago, most software is still standalone desktop applications and internet is not widely used. It is not straight-forward to know why software goes wrong and how software is used. You had to ask users directly, or asked them to send ‘core-dump’ to address the software errors.
Nowadays, more and more software is running on web, on mobile devices and in the ‘cloud’. We have better position to get telemetry data due to the better infrastructure. There is risk that you will lose the competitive power if your competitors use the telemetry data while you do not.
Telemetry technology becomes crucial to the software business. You need to understand whether the servers are performing well, whether your software is healthy and how your software is used. The information is critical to your business, and you will find the details in the next chapter.
Usage of Telemetry
In software industry, how we are going to benefit from telemetry technology?
The following scenarios are relevant to telemetry technology.
Health monitoring
We are curious about whether a system is healthy, whether it is running and capable of processing requests.
Availability monitoring
A truly healthy system requires that the components and subsystems that compose the system are available. Availability monitoring is closely related to health monitoring.
Performance monitoring
As the system is placed under more and more stress (e.g. by increasing the volume of users), the size of the datasets that these users access grows and the possibility of failure of one or more components becomes more likely. Frequently, component failure is preceded by a decrease in performance. If you’re able detect such a decrease, you can take proactive steps to remedy the situation.
Performance trending
Performance trending chart is useful to show how software performs under stress. To know whether the performance is improved or become worse and identify the hotspots.
Auto scaling
Auto scaling can be a proactive action if performance becomes worse due to increased workload.
Security monitoring
All commercial systems that include sensitive data must implement a security structure. You must be prepared to monitor all requests to all resources regardless of the source of these requests.
For example: * A large number of failed sign-in attempts might indicate a brute-force attack. * An unexpected surge in requests might be the result of a distributed denial-of-service (DDoS) attack. * A system that has a sign-in vulnerability might accidentally expose resources to the outside world without requiring a user to actually sign in.
SLA monitoring
Many commercial systems that support paying customers make guarantees about the performance of the system in the form of SLAs.
Essentially, SLAs state that the system can handle a defined volume of work within an agreed time frame and without losing critical information.
SLA monitoring is concerned with ensuring that the system can meet measurable SLAs.
Auditing
Depending on the nature of the application, there might be statutory or other legal regulations that specify requirements for auditing users’ operations and recording all data access.
Auditing can provide evidence that links customers to specific requests.
Non-repudiation is an important factor in many e-business systems to help maintain trust be between a customer and the organization that’s responsible for the application or service.
Usage monitoring
Usage monitoring tracks how the features and components of an application are used.
Facilitate decision making
Determine which features are heavily used and which are infrequently used. Evaluation can be done on the business value of features, design of the software, and identify potential hotspots in the system.
This information can be used for capacity planning as the number of customers grows.
Detect (possibly indirectly) user satisfaction with the performance or functionality of the system.
Billing & enforce quota
A commercial application or multitenant service might charge customers for the resources that they use.
If a user in a multitenant system exceeds their paid quota of processing time or resource usage during a specified period, their access can be limited or processing can be throttled.
Issue tracking
Customers and other users might report issues if unexpected events or behavior occurs in the system.
Issue tracking is concerned with managing these issues, associating them with efforts to resolve any underlying problems in the system, and informing customers of possible resolutions.
The information will help a lot for:
Root cause analysis
Trouble shooting
Technical choices overview
There are several technical choices in telemetry. Please be aware the technique is changing rapidly in this area, it is a moving target. You have to refresh the knowledge from time to time to catch up the latest changes.
Microsoft Stack
Application Insight
Very easy to use for web apps, you can get a lot of telemetry data/charts out-of-box. Azure Log Analytics also provides search functionality. Smooth integration to other Microsoft tools, e.g. PowerBI
HockeyApp
Telemetry tool for mobile apps.
PowerBI
Handy tool for dashboard/report/chart.
Elastic Stack
Elasticsearch
Elasticsearch is on a mission to organize data and make it easily accessible.
Logstash
Logstash is the central dataflow engine in the Elastic Stack for gathering, enriching, and unifying all of your data regardless of format or schema.
Kibana
Kibana is a window into the Elastic Stack. It enables visual exploration and real-time analysis of your data in Elasticsearch.
Other choices
Google Analytics
Splunk
Keen.io
CloudWatch
This blog is just to introduce the telemetry overview, and there will be follow-up blogs to discuss the technical details.
Written by Binwei@Oslo